Queue Activity Column Chart
This widget displays in the UI with the following names:
-
Queue Activity
-
Weekly Queue Activity
For each Queue associated with the selected Job Server, the Weekly Queue Activity column chart shows the total number of Jobs run each week for the selected time period.
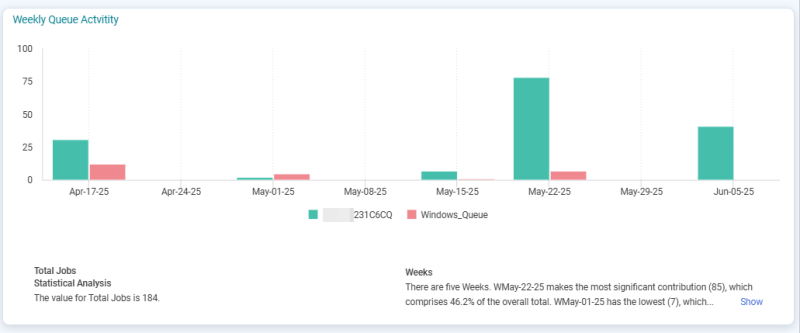
To view a generated explanation, right-click a column and choose Explanations.
To view a narrative analysis, click Show/Hide at the bottom of the widget.