Weekly Queue Activity Line Chart
The Weekly Queue Activity line chart shows Queues that have an unusually high Job volume or failure rate. This information can help you identify potential configuration issues, bottlenecks, and/or other factors that may be contributing to unexpected performance issues.
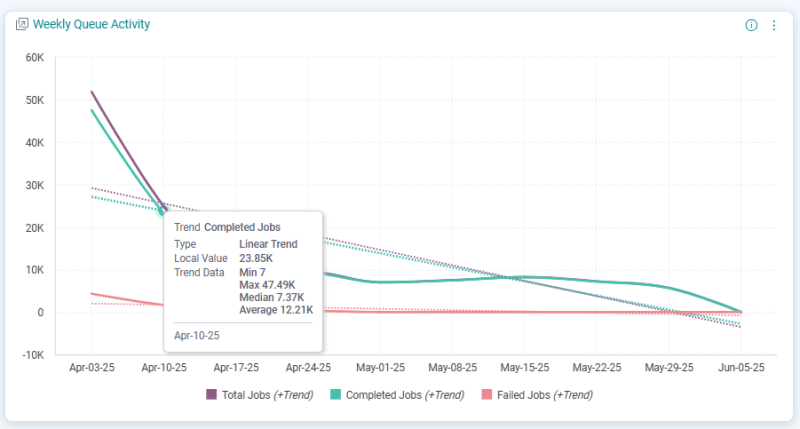
The Weekly Queue Activity line chart displays the weekly number of Total Jobs, Completed Jobs and Failed Jobs for the selected Queue.
To view a generated explanation, right-click a line and choose Explanations.
To view a narrative analysis, click Show/Hide at the bottom of the widget.