Today’s Hourly Activity Line Chart
This widget displays in the UI with the following names:
-
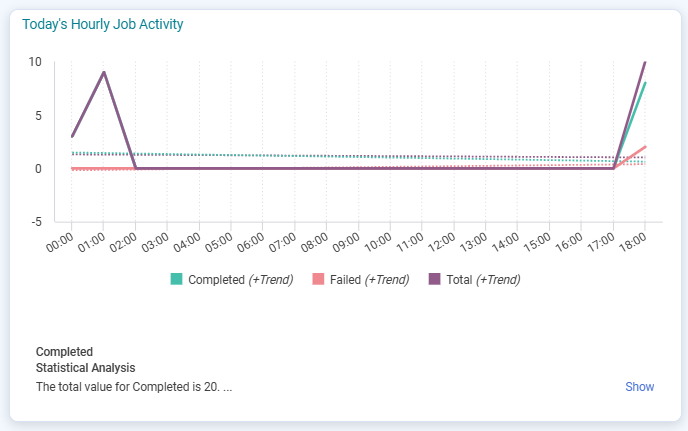
Today's Hourly Job Activity
-
Today's Hourly Queue Activity
This widget shows an hourly summary of how many Jobs ran (purple line), how many Jobs completed successfully (green line), and how many Jobs failed (red line) in the current day. In the Operator Overview dashboard, this widget shows data for the entire RunMyJobs environment.
For each line color, a solid line represents actual data, and a dashed line represents trend analysis.
To display a Job History dashboard with a list of the Jobs that account for the total value displayed, click a data point on the line and choose Open > Today's Job Details.