SLA Dashboard
Note: This topic refers mainly to "Jobs," but what it describes also applies to Workflows.
To display the SLA Dashboard screen, navigate to Configure > Extensions > SLA Dashboard.
Refresh Control
Use the refresh  menu at the top to manually refresh the dashboard, set an automatic refresh interval, or disable automatic refresh.
Columns
You can add, remove, and rearrange the columns displayed in the SLA Dashboard. To do so, right-click a column header and choose Column Chooser. Click and drag to move a column from one column to another, or to change the order in which the columns display.
 Column
This column displays a green dot if a Job is active.
Rule Name Column
The Rule Name column displays the name of the SLA Rule. You can edit a rule definition by clicking its name in this column.
Time Remaining Column
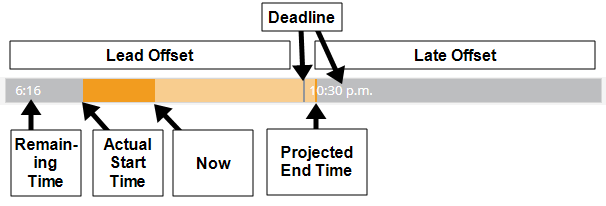
The Time Remaining column displays the status of each monitored Job in a color-coded graphic format.
To understand this column, you must understand the concepts of Lead Offset and Late Offset.
The anatomy of this column is as follows.
-
The full width of this column represents the amount of time that the Job is monitored, as defined in the SLA Rule.
-
The line in the middle is the deadline for the Job, as defined in the SLA Rule. The Job's SLA Deadline is displayed to the right of this line.
-
The area to the left of the deadline is the Lead Offset.
-
The area to the right of the deadline is the Late Offset.
-
If a Job is active, its remaining time displays at the beginning of the bar.
The Time Remaining column can display the following color-coded bar indicators.
| Color | Range | What it Means |
|---|---|---|
|
Light green |
Starts at the Job's predicted start time. | The Job is projected to finish on time. |
| Dark green | Starts at the Job's actual start time and ends at the Job's actual end time. | The Job finished on time. |
| Light Orange | Starts at the Job's predicted start time. | The Job is projected to finish after the deadline. |
| Dark Orange | Starts at the Job's actual start time and ends at the Job's actual end time. | The Job finished after the deadline, but within the Late Offset. |
| Red | Fills the entire bar. | Indicates that the Job Missed (failed to run during the monitored window). |
In this example, the Job both started and ended during the Lead Offset.

In this example, the Job is projected to start and end during the Lead Offset.

In this example, the Job is running (as indicated by the remaining time on the left), but it is projected to finish after the deadline.

In this example, the Job did not start within the monitored time.

Trending Column
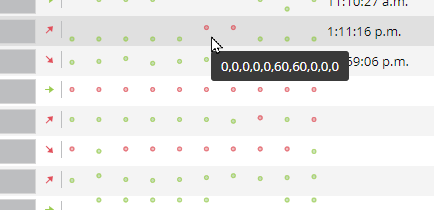
This column displays info about a Job's recent performance in terms of whether they finish on time or not, and by how many minutes they hit or miss the deadline. It covers the previous ten monitored executions of the Job Definition.
The components of this column are as follows.
-
Each dot indicates a single monitored run of the Job. The meaning of the dot's color depends on the Type of the SLA Rule.
-
If Type is set to SLA for endtime, The dot is green if the Job completed at or before the SLA Deadline, or red if the it completed after the SLA Deadline.
-
If Type is set to SLA for starttime, The dot is green if the Job started at or before the SLA Deadline, or red if it started after the SLA Deadline.
-
-
The vertical offset of each dot from the bottom indicates how far off that execution was from the SLA Deadline. The lower a dot is, the closer it executed to the SLA Deadline. For example, assume you have an SLA for Endtime rule with an SLA Deadline of 1:00 PM. If the Job finishes at 12:30 PM, the vertical offset of the dot represents minus 30 minutes (that is, the Job completion time, minus the SLA Deadline, or 30 minutes early). However, if the Job finishes at 1:30 PM, the offset represents positive 30 minutes (or 30 minutes late). You can see the actual number of minutes for each dot by hovering the mouse over the row.
-
The arrow at the beginning indicates the slope of the trend in the dots.
-
A green arrow indicates that the slope is zero. This can mean the Job is always hitting its SLA Deadline or always missing it.
-
A red arrow pointing upward indicates that the slope is negative. In other words, the Job is trending toward missing its SLA Deadine.
-
A red arrow pointing downward indicates that the slope is positive. In other words, the Job is trending toward hitting its SLA Deadine.
-
No arrow indicates that there is not enough data to calculate the slope.
-
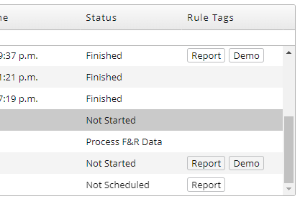
Status Column
This column indicates the current status of the Job.
There are three phases that each rule goes through. Each phase has one or more possible statuses that can display in this column.
-
Prediction phase. During this phase, RunMyJobs uses historical data to estimate when the Job will start.
-
Not Scheduled: The Job has not yet been scheduled.
-
Not Started: The Job has been scheduled, but has not yet started.
-
Not Started Late: The Job has not yet started, and it is forecast to start (if Type is set to SLA for starttime) or end (if Type is set to SLA for endtime) after the deadline but before the Late Offset.
-
Not Started Very Late: The Job has not yet started, and it is forecast to start (if Type is set to SLA for starttime) or end (if Type is set to SLA for endtime) after the Late Offset.
-
-
Active phase. During this phase, the Job is executing. For Workflows, the active step name is displayed. For single Jobs, the Job Description is displayed.
-
Final phase. During this phase, RunMyJobs determines the final status of the execution.
-
Never Started: The Job did not begin execution during the rule window.
-
Finished: The Job started (if Type is set to SLA for starttime) or completed (if Type is set to SLA for endtime) before the SLA Deadline.
-
Late: The Job started (if Type is set to SLA for starttime) or completed (if Type is set to SLA for endtime) within the rule window, but after the SLA Deadline.
-
Missed: The Job did not complete (if Type is set to SLA for endtime) within the rule window. This status is not displayed if Type is set to SLA for starttime (in that case, the status would be reported as Never Started).
-
Time Column
The Time column shows the time at which the Job actually completed.
Predicted Column
The Predicted column shows the time at which the Job was predicted to start.
Rule Tags Column
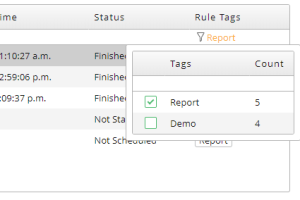
Rule tags let you filter the Jobs displayed in the SLA Dashboard.
When you are creating an SLA Rule, you can enter a comma-separated list of arbitrary strings in the Rule Tags field. In the SLA Dashboard, those rule tags display in the Rule Tags column. You can then filter the dashboard by clicking the tags.
For example, assume you are using the rule tags "Report" and "Demo" in your rule definitions. Some rules are tagged only as "Report", others are tagged only as "Demo," and others have no rule tags.
If you click the Report tag in one of the rows, a filter is added to display only SLA Rules with the "Report" rule tag.
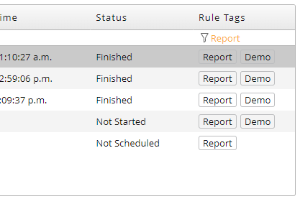
You can also click the funnel icon at the top of the Rule Tags column to display a list that lets you choose which rule tags to filter on.