Operator Overview Dashboard
The Operator Overview dashboard provides an overview of your RunMyJobs environment. It does not take the place of other RunMyJobs views such as the Monitor screen, but rather attempts to show areas that may require further inspection based on any unusual patterns or Key Performance Indicators.
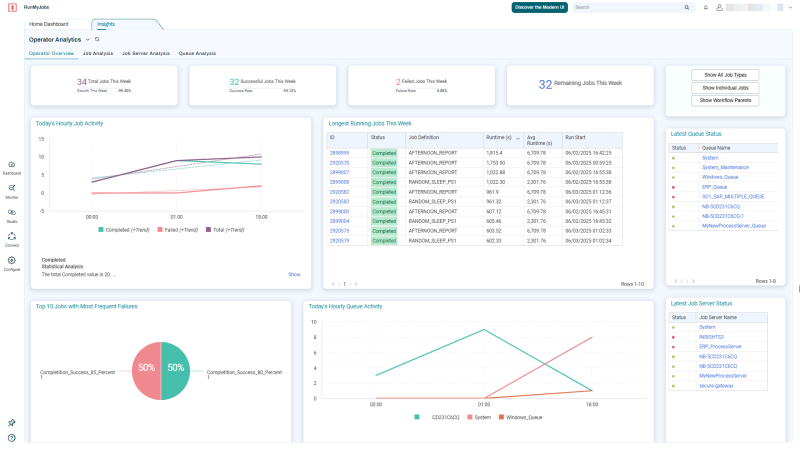
By design, the Operator Overview dashboard shows data for the current week. (The Today’s Hourly Activity and Today’s Hourly Queue Activity widgets are exceptions. These are limited to the current day.) Although other dashboards can be filtered by time range, the Operator Overview dashboard shows only the most recent activity, so that you can focus on things that need immediate attention rather than historical analysis.
For an Operator, the Operator Overview dashboard provides quick answers to questions such as:
-
How many Jobs for the current week were run? How many of those were successful, and how many failed? How many were individual Jobs, and how many were Workflows?
-
What does today’s hourly volume look like?
-
Are there any long-running Jobs this week that may need further inspection?
-
Which Jobs have failed the most frequently this week? Why?
-
What are the most recent Queue and Job Server statuses?
The Operator Overview Dashboard includes the following dashboard widgets: