Queue Analysis Dashboard
The Queue Analysis dashboard lets Operators monitor and respond to issues with Queues.
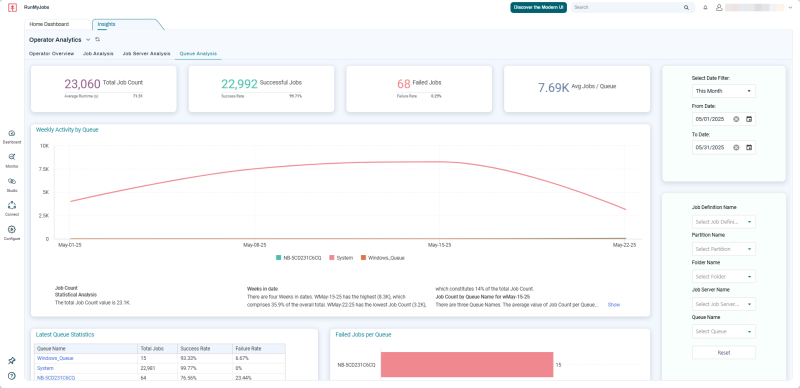
By default, the Queue Analysis dashboard shows data for the current month. However, you can adjust the time range and individual Object filters for answers to questions such as:
-
Which Queues have the highest volume?
-
How many Jobs are processed by a Queue on average?
-
Are there any unusual spikes in Queue activity?
-
Which Queues have the most Job failures?
-
What is the latest Queue Status?
The Queue Analysis dashboard includes the following dashboard widgets: